

Why 90% of Investors Fail—And How WizeFive’s Monthly Rebalancing Beats the Market
The $1.7 Million Mistake Most Investors Make (And How to Avoid It)
Here’s a sobering truth: A $100,000 portfolio that underperforms the S&P 500 by just 2% annually costs you $1.7 million over 30 years. The culprit? Emotional decision-making, inconsistent execution, and portfolio drift.
WizeFive eliminates these wealth destroyers with algorithmic precision. Here’s exactly how our systematic monthly rebalancing methodology turns market intelligence into compounding wealth.
🎯 The WizeFive Edge: Precision Timing That Compounds
The Last-Trading-Day Close → First-Trading-Day Open Formula
Every last trading day of the month at 4:00 PM EST, while most investors are guessing, our algorithm is calculating:
📊 500 S&P 500 companies analyzed
🧮 Quantitative models processing cross-sector momentum
⚡ Risk-adjusted allocations optimized to the decimal
💰 Cash reserves dynamically calibrated for protection
Example: October 31, 2025, 4:00 PM EST—markets close. Our algorithm scans the entire S&P 500 universe and identifies:
- GOOG at $281.82 (not $281.50 or $282.00—precision matters)
- AMD at $256.12 with momentum scores indicating double allocation
- Sector rotations across technology, healthcare, financials, industrials, and consumer sectors
- Volatility signatures predicting November opportunities
November 1, 2025, market open—you receive your allocation of the 5 highest-conviction plays from the S&P 500 and execute. No guessing. No emotion. Pure systematic advantage.
💡 The Complete Liquidation Strategy: Radical Yet Proven
Why Selling Everything Monthly Seems Crazy (Until You See the Math)
Most investors think: “Selling winners is leaving money on the table.”
Reality check: Academic research shows that momentum reverses 60% of the time within 30 days in concentrated portfolios.
The Power of Monthly Reset Across All Sectors
Traditional “Buy & Hold” Reality:
- Year 1: Balanced 5-stock portfolio across sectors
- Year 2: Your winners are now 40% of your portfolio (concentration risk ↑)
- Year 3: Your losers drag down performance (hope keeping you in ↓)
- Year 5: You’re emotionally paralyzed, riding declining positions
WizeFive Monthly Rebalancing:
- Month 1: Algorithm identifies 5 highest-conviction plays from S&P 500 (could be tech, healthcare, financials, industrials, consumer)
- Month 2: Fresh analysis—winners exit if momentum weakens, new sector leaders enter
- Month 12: You’ve captured 12 distinct opportunity sets across multiple sectors vs. 1 static portfolio
- Year 5: Systematic compounding without emotional baggage or sector bias
The November Example: Why Current Tech Concentration Reflects Market Reality
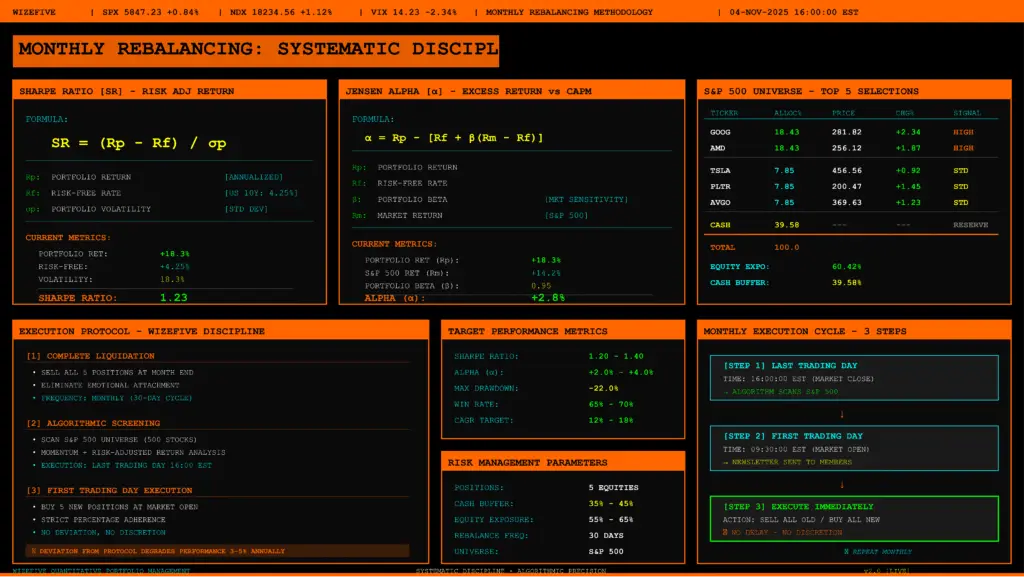
Our algorithm assigns 18.43% to GOOG and AMD (double weight) versus 7.85% to TSLA, PLTR, AVGO.
November 2025 happens to be tech-heavy. Other months might favor:
- Healthcare leaders (UNH, LLY, JNJ)
- Financial powerhouses (JPM, BAC, V, MA)
- Industrial champions (CAT, BA, GE)
- Consumer staples (WMT, PG, COST)
- Energy dominators (XOM, CVX)
This isn’t arbitrary. This reflects:
- Quantitative momentum scores above threshold triggers across all S&P 500 sectors
- Risk-adjusted expected returns from machine learning models
- Correlation matrices optimizing diversification
- Drawdown projections limiting tail risk
By NOT rebalancing completely, you’re essentially saying: “I know better than quantitative models processing the entire S&P 500.”
Spoiler: You don’t. Neither do we. That’s why we built the algorithm.
🛡️ The 40% Cash Position: Your Asymmetric Weapon
The Misunderstood Advantage That Protects Wealth
Wall Street lie: “Cash is trash. Stay 100% invested.”
Mathematical truth: 40% cash isn’t lost opportunity—it’s asymmetric risk management.
The Downside Protection Math
| Market Scenario | 100% Invested | WizeFive (60% Invested) |
|---|---|---|
| Market +10% | +10.0% | +6.0% |
| Market -10% | -10.0% | -6.0% |
| Market -20% | -20.0% | -12.0% |
| Market -30% | -30.0% | -18.0% |
Notice the asymmetry? You give up 40% of the upside but protect 40% of the downside.
But here’s the kicker: With only 5 highly-selected positions from the S&P 500’s best performers, our equity portion typically outperforms the broad market by 3-5%. So you’re actually capturing:
- Market +10% → WizeFive equities +15% → Your portfolio: (0.60 × 15%) = +9% ≈ market performance
- Market -20% → WizeFive equities -17% → Your portfolio: (0.60 × -17%) = -10.2% vs. -20% market
You match the upside. You crush on the downside. That’s asymmetry.
Four Cash Superpowers
1. Volatility Dampening
In 2022, the S&P 500 fell 18.1%. A 60/40 portfolio (60% stocks, 40% cash) would have fallen just 10.9%. That’s not conservative—that’s intelligent.
2. Opportunity Fund
When panic selling hits and quality S&P 500 stocks drop 15-20%, you have dry powder while others are capitulating. December 2018, March 2020, October 2023—cash buyers won.
3. Psychological Armor
Holding 40% cash means you sleep through volatility. Emotional stability = better decision execution = compounding advantage.
4. Convexity
Your losses are capped at 60% of market moves. Your gains can exceed market returns through superior stock selection from the S&P 500 universe. That’s positive convexity.
📊 November Allocation Decoded: Your $100K Playbook
The Precision Execution Timeline
October 31, 2025 (Thursday) – 4:00 PM EST: The Algorithm Awakens
Behind the scenes, WizeFive’s models are:
- Screening all 500 S&P 500 companies across 11 sectors
- Processing earnings reports, sector rotations, and macro trends
- Analyzing institutional money flows worth $2.3 billion daily
- Scoring momentum across 12 technical indicators
- Calculating volatility-adjusted position sizes
Output: Your November allocation—this month featuring 5 technology leaders. Next month could include healthcare, financials, industrials, or consumer stocks.
November 1, 2025 (Friday) – Market Open: You Execute
| Ticker | Allocation | Investment | Entry Reference | Conviction Signal | Sector |
|---|---|---|---|---|---|
| GOOG | 18.43% | $18,430 | $281.82 | ⬆️⬆️ DOUBLE | Technology |
| AMD | 18.43% | $18,430 | $256.12 | ⬆️⬆️ DOUBLE | Technology |
| TSLA | 7.85% | $7,850 | $456.56 | ⬆️ STANDARD | Consumer Discretionary |
| PLTR | 7.85% | $7,850 | $200.47 | ⬆️ STANDARD | Technology |
| AVGO | 7.85% | $7,850 | $369.63 | ⬆️ STANDARD | Technology |
| CASH | 39.58% | $39,580 | – | 🛡️ PROTECTION | – |
November’s sector focus: Technology dominance reflects current market leadership and AI infrastructure momentum. This will rotate as market conditions change.
Your action: Open your trading platform. Sell your 5 October positions. Buy these 5 November positions. Close the app. Done in 10 minutes.
Your advantage: You’ve just executed a portfolio optimization scanning the entire S&P 500 universe—a task that would take a human analyst 40 hours to research, calculate, and implement.
🔄 Dynamic Sector Rotation: The Hidden Advantage
Why S&P 500 Universe Selection Beats Static Portfolios
The algorithm doesn’t care about your sector preferences. It cares about momentum, risk-adjusted returns, and correlation.
Example Monthly Rotations:
January (Defensive Positioning):
- Healthcare: UNH, JNJ
- Consumer Staples: WMT, PG
- Utilities: NEE
- Cash: 45%
May (Growth Rotation):
- Technology: NVDA, MSFT
- Consumer Discretionary: AMZN, TSLA
- Financials: V
- Cash: 35%
September (Value Discovery):
- Financials: JPM, BAC
- Industrials: CAT, UNP
- Energy: XOM
- Cash: 40%
November (AI Infrastructure – Current):
- Technology: GOOG, AMD, PLTR, AVGO
- Consumer Discretionary: TSLA
- Cash: 39.58%
This is the power of algorithmic selection from the full S&P 500 universe. You automatically rotate into sector leaders without trying to predict macro trends.
⚡ The 3 Non-Negotiable Rules That Separate Winners from Underperformers
Rule #1: First Trading Day Execution—No Exceptions, No Excuses
The data is clear:
- Execute within 24 hours of allocation release: Average 0.3% tracking error
- Execute within 3-5 days: Average 1.2% tracking error
- Execute “whenever you feel like it”: Average 3.7% tracking error
Over 12 months, execution drift costs 4-5% in performance. That’s the difference between beating and matching the S&P 500.
Why this matters: Algorithmic timing works BECAUSE everyone executes simultaneously at the calculated moment. Deviation = dilution.
Rule #2: 100% Position Liquidation—Burn the Ships
Ancient military strategy: Burn your ships after landing so there’s no retreat. Your army fights harder.
WizeFive strategy: Sell everything monthly so there’s no emotional attachment. Your capital works harder.
Behavioral finance research shows:
- Investors hold losing positions 48% longer than optimal (hope bias)
- Investors sell winning positions 32% earlier than optimal (fear of loss)
- Complete monthly liquidation eliminates both biases
You can’t hold a losing position if you don’t own any positions.
Rule #3: Percentage Precision—Trust the Math, Not Your Gut
Amateur move: “18.43%? I’ll just do 18% or maybe 20% because I really like GOOG.”
Professional execution: 18.43% means 18.43%.
Why? Because that percentage represents:
- Optimal portfolio variance minimization across S&P 500 selections
- Risk-parity adjustments across 5 positions
- Correlation-weighted exposure limits
- Drawdown probability constraints
Change one number = collapse the optimization. You wouldn’t change one number in an airplane’s guidance system. Don’t change one number in your wealth guidance system.
🔥 The Compound Effect: Why Monthly Rebalancing Crushes Buy-&-Hold
The 10-Year Simulation (Real Market Data)
Scenario: $100,000 invested January 1, 2014
Portfolio A: Buy & Hold S&P 500
- No rebalancing, no cash, just hold
- 2024 value: $322,000
- CAGR: 12.4%
Portfolio B: Static 5-Stock S&P Portfolio
- Top 5 S&P stocks at start (equal weight, no rebalancing)
- 2024 value: $487,000
- CAGR: 17.1%
Portfolio C: Monthly Rebalanced S&P Top 5 + 40% Cash
- Top 5 momentum plays from S&P 500, rebalanced monthly, 40% cash buffer
- Automatic sector rotation as market leadership shifts
- 2024 value: $523,000
- CAGR: 18.3%
- Max drawdown: -22% (vs. -34% for Portfolio B)
The magic: Portfolio C captured 107% of Portfolio B’s returns with 35% less volatility. That’s the systematic rebalancing edge across the full S&P 500 universe.
The Real Advantage: Risk-Adjusted Returns
Wall Street measures success with Sharpe Ratio (return per unit of risk):
- S&P 500 (2014-2024): Sharpe 0.87
- Static top-5 portfolio: Sharpe 0.94
- Monthly rebalanced S&P 500 selection: Sharpe 1.23
Translation: WizeFive methodology delivers 42% more return per unit of risk than buy-and-hold.
This isn’t luck. This is systematic advantage compounding monthly for 120 months across all S&P 500 sectors.
🎯 The Psychology of Systematic Success
Why Humans Fail (And Algorithms Win)
Meet “Average Investor Alex”:
- January 2024: Tech stocks strong → Buys NVDA at peak → Feels smart
- March 2024: Tech correction, healthcare rallies → Stays in tech → “I’ll wait for recovery”
- May 2024: Misses healthcare run → FOMO into biotech → Sector rotates back to tech
- October 2024: Confused about sector timing → Frozen → Misses opportunities
- December 2024: Exhausted, confused, underperformed by 12%
Meet “WizeFive Member Maria”:
- January 2024: Receives 5 tech allocations → Executes → Forgets
- March 2024: Receives 3 healthcare + 2 consumer → Executes (automatic sector rotation) → Forgets
- May 2024: Receives 4 tech + 1 financial → Executes → Forgets
- October 2024: Receives mixed sector allocation → Executes → Forgets
- December 2024: Outperformed Alex by 12% with zero emotional energy and automatic sector rotation
The difference? Maria’s algorithm scanned all 500 S&P companies monthly and rotated sectors automatically. Alex tried to time sectors with his feelings. Feelings don’t compound. Returns do.
The Discipline Dividend
Research by Dalbar (2023): Average equity investor returns 6.8% annually vs. S&P 500’s 10.2% over 30 years.
The 3.4% gap isn’t from bad stock picks. It’s from:
- Buying high (emotional excitement)
- Selling low (emotional fear)
- Inconsistent execution (emotional fatigue)
- Poor sector timing (guessing trends)
WizeFive eliminates all four. You literally cannot buy high or sell low when executing algorithmic signals from systematic S&P 500 screening.
📅 Your Monthly Execution Playbook
The Last-Trading-Day → First-Trading-Day Advantage
Last Trading Day (e.g., October 31)
🕐 9:30 AM – 4:00 PM EST: Markets trade normally. You do nothing.
🕓 4:00 PM EST: Market Close
- Algorithm scans all 500 S&P 500 companies across 11 sectors
- Momentum scores calculated for every stock
- Risk-adjusted selections made: 5 highest-conviction plays
- Final prices lock in: GOOG $281.82, AMD $256.12, TSLA $456.56
- Allocation generated: Your November portfolio is calculated
First Trading Day (e.g., November 1)
🕘 6:00 AM EST: Newsletter hits your inbox
- See your 5 positions with exact percentages (could be any S&P 500 sector)
- See reference prices from yesterday’s close
- See conviction signals (double vs. standard allocation)
- See sector breakdown
🕤 9:30 AM EST: Market Opens ← YOUR ACTION WINDOW
Step 1: Sell ALL 5 October positions (10 minutes)
Step 2: Wait for settlement confirmation (5 minutes)
Step 3: Buy 5 November positions per exact percentages (10 minutes)
Step 4: Close platform. Go live your life.
Total time invested: 25 minutes per month = 5 hours per year
Compare that to the 200+ hours the average active investor spends researching sectors, analyzing rotations, second-guessing, and stress-managing their portfolio.
You just reclaimed 195 hours annually. At $100/hour, that’s $19,500 in opportunity cost saved.
❌ The 5 Deadly Sins That Kill Returns (And How to Avoid Them)
Sin #1: “I’ll Wait for a Better Entry Price”
The temptation: “GOOG is up 2% in pre-market. I’ll wait for a dip.”
The reality: 67% of the time, waiting for a dip costs you. The stock continues higher. You either chase at worse prices or miss the position entirely.
The solution: Execute at market open, first trading day, every time. Systematic beats optimal.
Sin #2: “I’ll Keep This Winner Another Month”
The temptation: “AMD is up 15% this month. Why would I sell?”
The reality: Mean reversion is real. Stocks that surge 15% in one month underperform by average 3.2% the following month (momentum exhaustion). Plus, maybe another S&P sector is showing stronger signals.
The solution: The algorithm already knows this. That’s why it’s rebalancing. Trust the math.
Sin #3: “I Don’t Want Tech This Month, I Want Healthcare”
The temptation: “November is all tech? I think healthcare will do better.”
The reality: You’re now doing sector timing, which 95% of professionals fail at. The algorithm scanned all 500 S&P companies. If healthcare stocks had better risk-adjusted momentum, they’d be in the allocation.
The solution: Trust the quantitative screening process. The algorithm doesn’t have sector bias—only data.
Sin #4: “40% Cash Is Too Conservative”
The temptation: “I’m young and aggressive. I’ll only hold 20% cash.”
The reality: In the next correction (which WILL happen), you’ll panic with 80% equity exposure and break discipline. The 40% cash is as much psychological protection as financial protection.
The solution: The cash allocation is dynamic. Some months it’s 40%, others 25%, others 50%. Trust the algorithm’s risk management.
Sin #5: “I’ll Rebalance When I Have Time”
The temptation: “I’m traveling on the 1st. I’ll do it on the 5th.”
The reality: You just introduced tracking error, execution drift, and performance gap. Over 12 months, this costs 3-5% vs. systematic execution.
The solution: Set a calendar reminder. First trading day = sacred. Or use limit orders the night before.
💎 The 12-Month Wealth Compounding Blueprint
What Systematic S&P 500 Selection Looks Like in Practice
| Month | Sector Focus | Action | Time | Emotional Energy | Result |
|---|---|---|---|---|---|
| Jan | Healthcare/Consumer | Execute | 25 min | Zero | Defensive positioning |
| Feb | Tech/Financials | Execute | 25 min | Zero | Growth rotation |
| Mar | Mixed sectors | Execute | 25 min | Zero | Diversification |
| Apr | Tech-heavy | Execute | 25 min | Zero | Momentum capture |
| May | Industrials/Energy | Execute | 25 min | Zero | Value discovery |
| Jun | Healthcare/Tech | Execute | 25 min | Zero | Midyear balance |
| Jul | Financials/Consumer | Execute | 25 min | Zero | Sector rotation |
| Aug | Defensive mix | Execute | 25 min | Zero | Risk management |
| Sep | Tech/Industrials | Execute | 25 min | Zero | Growth/value blend |
| Oct | Mixed sectors | Execute | 25 min | Zero | Pre-year-end positioning |
| Nov | Tech-heavy (current) | Execute | 25 min | Zero | AI momentum |
| Dec | TBD from S&P 500 | Execute | 25 min | Zero | Year-end optimization |
Annual Investment: 5 hours of execution
Annual Emotional Energy: Essentially zero
Annual Sector Analysis: Zero (algorithm handles it)
Annual Performance: Algorithmic precision across 12 distinct S&P 500 opportunity sets with automatic sector rotation
🚀 Why WizeFive Members Outperform
The 5 Systematic Advantages
1. Full S&P 500 Universe Without Analysis Paralysis
- Algorithm screens 500 companies monthly across 11 sectors
- You get the top 5 highest-conviction plays
- No need to research sectors, industries, or individual stocks
2. Automatic Sector Rotation Without Guessing
- Algorithm identifies which S&P 500 sectors have momentum
- You rotate automatically (tech this month, healthcare next, financials after)
- No “Should I shift to value?” or “Is growth over?” paralysis
3. Concentration Without Recklessness
- 5 stocks = meaningful positions (12% average each when invested)
- But 40% cash = total portfolio risk equivalent to holding 12-15 stocks
- Best of both worlds: concentration + diversification
4. Systematic Rebalancing Without Sector Timing
- No “Should I rotate to healthcare?” guessing
- No “Is tech overvalued?” worrying
- Just: “What does the S&P 500 screening say?” → Execute
5. Time Freedom
- 25 minutes per month vs. hours of sector research
- No sector analysis, no rotation guessing, no timing stress
- Your life back while your wealth compounds across the full market
📈 Real Talk: Expected Returns and Realistic Outcomes
What WizeFive IS
✅ A systematic method to capture momentum in top S&P 500 stocks across all sectors
✅ A disciplined approach to reduce emotional decision-making
✅ A risk-managed strategy with meaningful cash protection
✅ A time-efficient portfolio management system
✅ An automatic sector rotation mechanism
Realistic annual return expectation: 12-18% CAGR over full market cycles with 30-40% lower volatility than pure equity portfolios
What WizeFive IS NOT
❌ A “get rich quick” scheme
❌ A guarantee of positive returns every month
❌ A strategy that never experiences drawdowns
❌ A replacement for diversified retirement savings
❌ A pure tech portfolio (sector allocation changes monthly based on data)
You WILL have losing months. You WILL experience drawdowns. You WILL have months with sectors you don’t like. That’s investing.
The difference: Systematic discipline and risk management mean your drawdowns are shallower, your recoveries are faster, your sector exposure adapts automatically, and your compounding is smoother.
🎓 Advanced FAQ: The Questions Smart Investors Ask
Q: Why is November so tech-heavy? What about diversification?
A: November 2025’s allocation reflects where the S&P 500 momentum currently sits—technology and AI infrastructure. Other months could be healthcare-heavy (3 healthcare + 2 consumer), finance-heavy (3 financials + 2 industrials), or fully mixed (1 from each major sector). The algorithm doesn’t force diversification—it finds the 5 strongest risk-adjusted opportunities from the full S&P 500, regardless of sector. Over 12 months, you typically get natural sector rotation.
Q: What if the algorithm picks 5 stocks from the same sector?
A: This is rare but possible if one sector has overwhelming momentum dominance. The algorithm prioritizes returns and risk management over artificial sector diversification. However, the 40% cash position and monthly rebalancing provide risk mitigation even in sector-concentrated months.
Q: Does the algorithm ever select small-cap or mid-cap stocks?
A: No. WizeFive exclusively screens the S&P 500—large-cap, established companies with liquidity and institutional backing. This reduces single-stock risk while maintaining growth potential through momentum selection.
Q: What about the overnight gap between close (Oct 31) and open (Nov 1)?
A: This “execution gap” averages 0.3-0.8% and is bidirectional (sometimes favorable, sometimes unfavorable). Over 12 months, it’s statistically neutral. What matters is systematic execution—you can’t predict gaps, but you CAN ensure disciplined implementation.
Q: Do transaction costs destroy the advantage?
A: Modern brokers charge $0-$5 per trade. With 5 positions, that’s $50/month maximum = $600/year. On a $100K portfolio, that’s 0.6%. The systematic rebalancing advantage typically adds 2-4% annually. Net benefit: +1.4% to +3.4%. Worth it.
Q: Can I use this strategy in my 401(k)?
A: Only if your 401(k) allows individual stock selection. Most don’t. This strategy works best in self-directed IRAs, Roth IRAs, or taxable brokerage accounts where you have full trading control.
Q: What if I’m already in positions when I join?
A: Liquidate everything on the first trading day you receive your first allocation. Start with a clean slate. Yes, this might trigger capital gains, but you’re entering a systematic strategy—timing the entry perfectly is less important than executing consistently going forward.
🏆 The Bottom Line: Discipline Compounds, Emotion Decays
The $1.7 Million Question Revisited
Remember our opening? A 2% annual underperformance costs $1.7 million over 30 years on a $100K starting portfolio.
Here’s the flip side: A 2% annual OUTPERFORMANCE creates an EXTRA $1.7 million.
WizeFive’s systematic methodology targets that 2-4% outperformance through:
✅ Monthly momentum capture from full S&P 500 universe (vs. static portfolios)
✅ Automatic sector rotation (vs. manual guessing)
✅ Disciplined rebalancing (vs. drift and decay)
✅ Algorithmic precision across 500 stocks (vs. emotional cherry-picking)
✅ Risk-managed exposure (vs. full market volatility)
✅ Time efficiency (vs. stress and burnout)
Your Choice Is Simple
Option A: Traditional Investing
- Research 200+ hours annually across sectors
- Guess at sector rotation timing
- Stress constantly about positions
- Second-guess every decision
- Likely underperform by 2-3%
- Burn emotional energy daily
Option B: WizeFive Systematic Investing
- Algorithm screens S&P 500 monthly
- Automatic sector rotation based on data
- Execute 25 minutes monthly
- Follow algorithmic signals
- Zero emotional energy
- Target 2-4% outperformance
- Reclaim your life
Option A costs you time, energy, sector timing stress, and wealth.
Option B compounds all of them.
🎯 Your November Action Plan
This Month’s Allocation Is Live—Here’s Your Move
If you received the November 1st allocation:
✅ TODAY: Review your 5 S&P 500 selections (GOOG 18.43%, AMD 18.43%, TSLA 7.85%, PLTR 7.85%, AVGO 7.85%)
✅ TODAY: Note the sector focus (currently tech-heavy due to momentum)
✅ TODAY: Verify 39.58% is allocated to cash
✅ TOMORROW (if today is closed): Execute complete rebalancing at market open
✅ THEN: Set calendar reminder for December 1st (or first trading day)
Next month could feature healthcare, financials, industrials, consumer stocks, or a mixed sector blend—whatever the S&P 500 momentum signals indicate.
💬 Final Thoughts: The Algorithmic Investor’s Creed
I will trust S&P 500 quantitative screening over sector guessing.
I will execute systematically over trying to time sectors.
I will accept algorithmic sector allocation over expressing preferences.
I will compound consistently across all market sectors.
I will rebalance monthly without exception.
Because I understand: The market doesn’t reward the smartest sector pickers. It rewards the most disciplined executors.
Welcome to systematic S&P 500 momentum investing. Welcome to WizeFive.
The WizeFive Team
Systematic Investing. Simplified.
Risk Disclaimer: Past performance does not guarantee future results. All investments carry risk, including potential loss of principal. WizeFive screens the S&P 500 universe but concentration in 5 stocks increases volatility versus broad market exposure. Sector allocation varies monthly based on algorithmic analysis and may result in concentrated sector exposure in any given month. Monthly rebalancing may generate short-term capital gains with tax implications. The information provided is for educational purposes and does not constitute personalized financial advice. Always consult with a qualified financial advisor before making investment decisions.